tech-cost-transparency
Part B — Scenario Modelling & What-If: Results
Both scenarios are driven off a single parameter table (SCENARIO_PARAM), so any lever can be changed in one row and the views re-run. Baseline is the fully-loaded Q1 2025 cost of $40.17M.
Scenarios and assumptions
| Scenario | Lever | Value | Assumption | Justification |
|---|---|---|---|---|
| S1 Cloud migration | Share of Data Centre (CP04) moved to cloud | 15% | Migrated workload keeps serving the same products/apps; only unit cost and pool change | Consumers do not change, only where the workload runs |
| S1 Cloud migration | Pool re-tag | modelled | The migrated 15% is emitted as CP05 (Public Cloud) rows, not left blended inside CP04 | VW_SCENARIO_S1_BY_POOL shows CP04 shrinking and CP05 growing by the same $, so the move is auditable at the pool level, not just netted into a product/application total |
| S1 Cloud migration | Cloud cost factor | 1.10 | Cloud costs 10% more than owned DC for the migrated steady-state workload | Always-on workloads typically price above fully-owned DC unit cost at list rates |
| S1 Cloud migration | Share of migrated DC cost actually shed (dc_avoidable_pct) |
100% in the base case | No stranded facilities cost when 15% leaves | Optimistic: CP04 is a fixed cost pool. Stress-tested from 100% down to 0% in the sensitivity grid below |
| S2 Vendor increase | Rate rise on Vendor / Managed Service (CP06) | +8% | Full pass-through, no volume or scope change | Contractual rate rise with no renegotiation offset |
Results by product (fully-loaded)
| Product | Baseline | S1 (cloud) | S1 delta | S2 (vendor) | S2 delta |
|---|---|---|---|---|---|
| PR01 Compute | $20,078,169 | $20,103,609 | +$25,440 | $20,069,342 | -$8,827 |
| PR03 Database | $4,822,221 | $4,821,532 | -$688 | $4,947,541 | +$125,320 |
| PR05 End-User | $3,791,424 | $3,791,077 | -$347 | $3,789,755 | -$1,669 |
| PR07 Cloud Platform | $3,400,455 | $3,400,096 | -$359 | $3,493,400 | +$92,945 |
| PR02 Storage | $3,234,665 | $3,261,656 | +$26,991 | $3,233,079 | -$1,586 |
| PR06 Security | $2,941,865 | $2,941,596 | -$270 | $2,940,570 | -$1,296 |
| PR04 Network | $1,903,195 | $1,902,902 | -$293 | $1,902,387 | -$808 |
| Total | $40,171,994 | $40,222,468 | +$50,474 | $40,376,073 | +$204,079 |
Results by application (fully-loaded)
Ordered by size of the vendor-scenario impact. Application deltas reconcile to their product totals above.
| Application | Product | Baseline | S1 delta | S2 delta |
|---|---|---|---|---|
| Market Data Hub | Database | $2,808,974 | -$400 | +$73,092 |
| Settlement Platform | Database | $2,013,247 | -$289 | +$52,229 |
| Client Portal | Cloud Platform | $1,873,594 | -$196 | +$51,169 |
| Wealth CRM | Cloud Platform | $1,526,861 | -$162 | +$41,776 |
| Trade Capture | Compute | $8,521,043 | +$10,801 | -$3,744 |
| Risk Engine | Compute | $6,273,783 | +$7,955 | -$2,760 |
| Payments Gateway | Compute | $5,283,343 | +$6,684 | -$2,323 |
| Collaboration Suite | End-User | $3,791,424 | -$347 | -$1,669 |
| Identity & Access | Security | $2,941,865 | -$270 | -$1,296 |
| Data Lake | Storage | $1,856,958 | +$15,468 | -$910 |
| Network Backbone | Network | $1,903,195 | -$293 | -$808 |
| Document Store | Storage | $1,377,707 | +$11,524 | -$676 |
Interpretation
Scenario 1 (cloud migration): +$50,474, about +0.13% of the base. At product level it lands on Compute (+$25,440) and Storage (+$26,991), the two products Data Centre serves. At application level the largest single mover is Data Lake (+$15,468), a Storage application, because Data Centre splits half its cost to Storage and Storage has few applications, so the impact concentrates. The Compute applications (Trade Capture +$10,801, Risk Engine +$7,955, Payments Gateway +$6,684) absorb the rest. Every other application shows a small negative, which is overhead re-spreading (raising Data Centre cost lifts the base slightly, so the fixed overhead pool redistributes). Net of that reshuffle, the true economic impact is 15% of the $3.36M Data Centre pool at a 10% premium, which is $50,475.
Scenario 2 (vendor +8%): +$204,079, about +0.51% of the base. It lands entirely on the managed-service consumers. At application level, Market Data Hub (+$73,092) and Settlement Platform (+$52,229) carry the Database share, while Client Portal (+$51,169) and Wealth CRM (+$41,776) carry the Cloud Platform share. The small negatives elsewhere (notably the Compute apps) are again the overhead re-spread, not operational changes.
Sensitivity
Scenario 1 depends on two levers, and the second one matters more. The impact reduces to a closed form:
S1 delta = Data Centre cost ($3.36M) x 15% x (cloud cost factor - share of DC cost shed)
- Cloud cost factor. With all the migrated DC cost shed, the sign flips with the cloud price: +$50,474 at a 10% premium, -$50,475 at a 10% discount.
- Stranded cost. CP04 is a fixed cost pool (facilities, power, leases), so in the short run little of it leaves with the workload. If none of it is shed, the DC bill stays and cloud is paid on top: +$555k at a 10% premium.
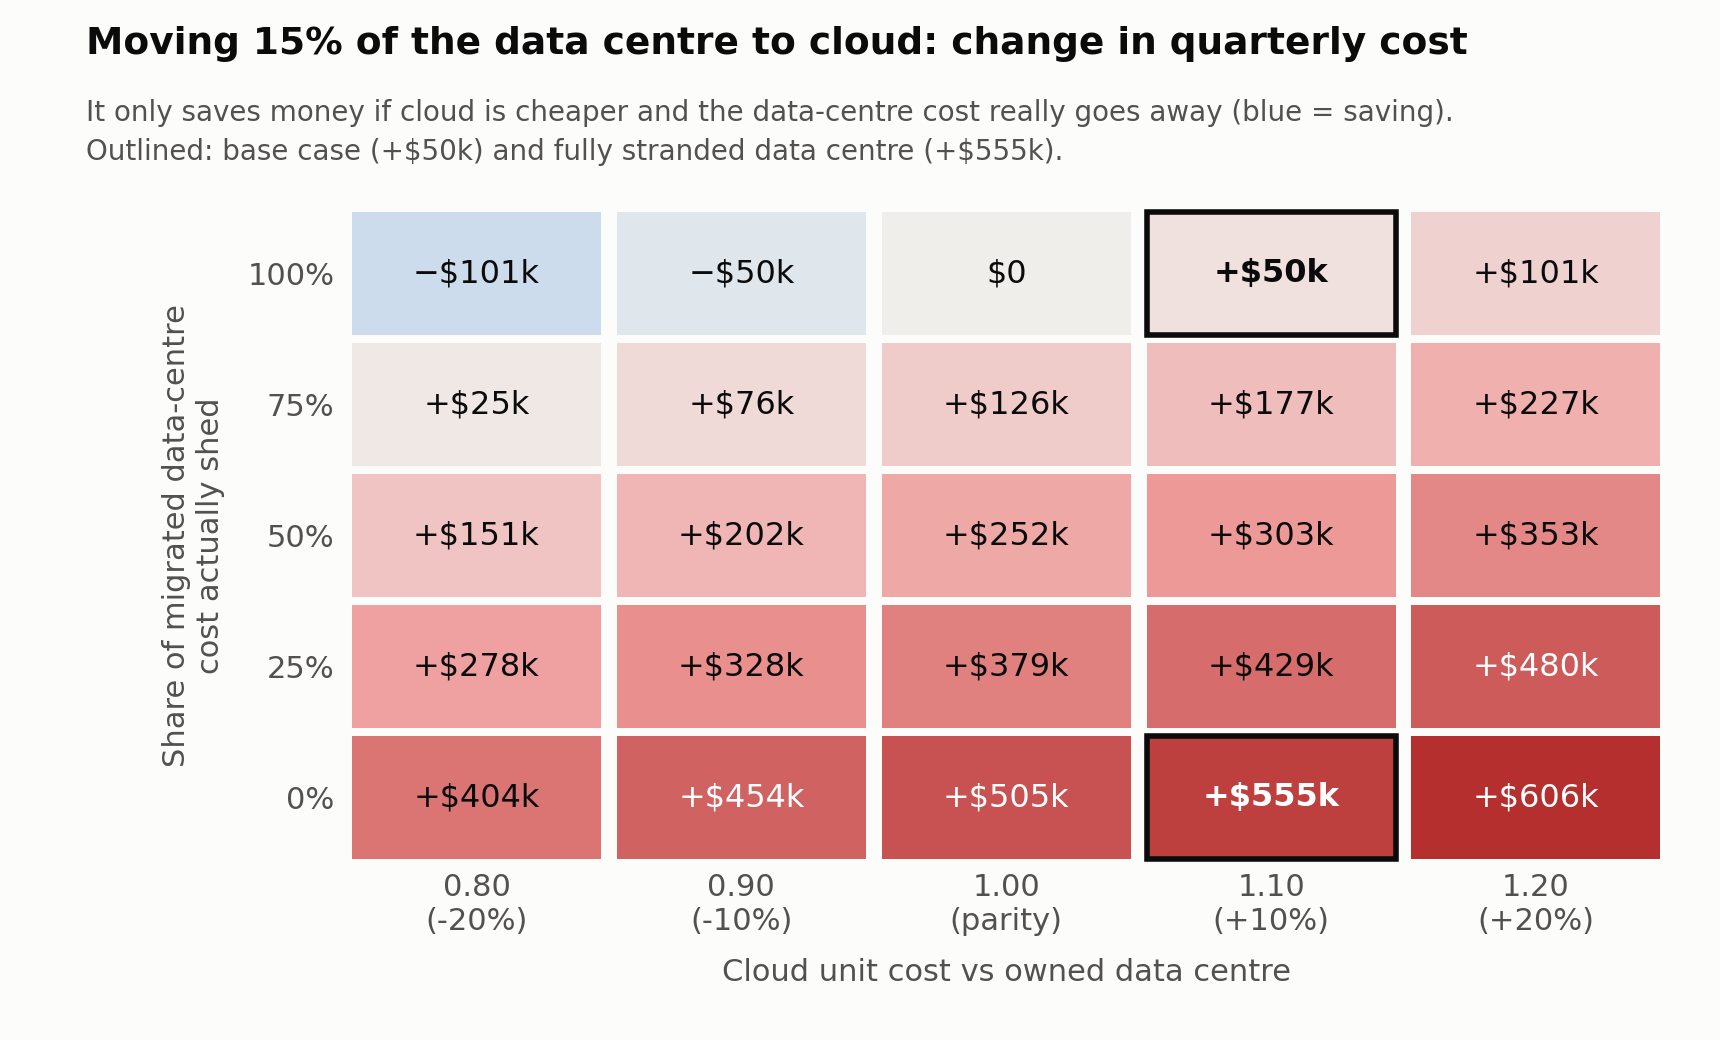
Only the top-left corner saves money: cloud has to be cheaper and nearly all the data-centre cost has to go away. Breakeven is where the share of DC cost shed equals the cloud cost factor, so even with a 20% cloud discount the move adds cost unless more than 80% of the data-centre cost really goes away. The full grid is in S1_sensitivity_grid.csv, produced by run_local.py. This is the assumption to stress before committing.
Scenario 2 is linear and has no sign risk. The result is simply +8% times the $2.55M vendor pool. The only offsets are commercial: renegotiating the rate or reducing managed-service scope. There is no modelling ambiguity.
Executive takeaways
- Neither scenario is material against a $40M base. The vendor increase (+$204k) is four times the cloud premium (+$50k) and is the more certain of the two.
- At application level, the vendor increase is felt most by Market Data Hub, and the cloud migration by Data Lake, useful for targeting owner conversations.
- The cloud migration decision is not really about the 15%, it is about whether cloud is cheaper or dearer per unit than owned Data Centre. Get that number right before committing, because it decides whether this saves or costs money.
- The vendor increase is worth pre-empting commercially, since it flows straight through to Database and Cloud Platform with no natural offset.